LED Grow Light Comparison: SunBlaster vs Active Grow
- Feb 18, 2021
- 8 min read
Updated: Mar 2, 2021
I have published detailed data on SunBlaster LED grow lights in the past and we had a challenger from Active Grow step forward recently by donating a similar product to us for testing. Therefore, I have taken the time to put some Active Grow LED lights through the same testing procedure as our SunBlaster LED lights in order to do a fair comparison of the value these two lights offer.
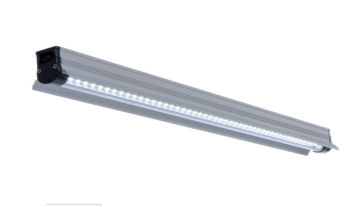
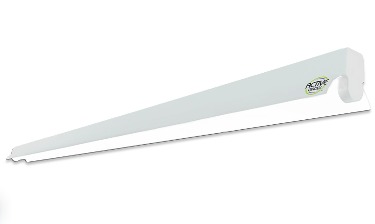
The photo on the left shows the SunBlaster LED strip light and the photo on the right shows the Active Grow LED strip light. Let's begin by reviewing the stats for each light.
SunBlaster LED (View Product Details)
Price: 124.99 to 129.99 CAD
Length: 48 inches
Power Consumption: 48 Watts
Light Spectrum:

Active Grow LED (View Product Details)
Length: 48 inches
Price: $119 USD for a 2-pack
Power Consumption: 23 Watts
Light Spectrum:

Testing Procedure
To conduct a fair comparison between these two products, I set up a controlled procedure for data collection. The lights were suspended over a 20 inch by 48 inch test grid and the light intensity was measured at the centre of each 4 inch square on the grid. The light was measured with an Apogee full spectrum quantum sensor which measures all of the light with wavelengths between 400nm and 700nm. Since plants are sensitive to light in that same spectrum range, this is the only way to truly measure the value of a light source for growing plants. Lumens are another common unit used in the measurement of light but they do not account for light in the full photosynthetic spectrum. See this post for more information about the science of grow lights.


Lamps were set up in a variety of configurations for this comparison, and all tests were conducted in our basement in a room with no interference from windows or other light sources. First, a single LED was suspended down the centre of the data collection surface at heights of 4 inches, 6 inches, and 8 inches. Next, the 2 LED lights were suspended 8 inches apart over the same surface and data was collected again for heights of 4 inches, 6 inches, and 8 inches. This two lamp configuration gives better light coverage over the entire 20 inch width of the data collection surface, a width commonly used for standard 10 inch by 20 inch seed starting trays as shown below.

Data and Analysis
The next couple of images show some of the data collected for the single and double light configurations. To simplify our analysis, I have just included the test data when the lamps were suspended 6 inches above the light sensor. Data was recorded for heights of 4 inches and 8 inches as well, but that data was not necessary for this comparison.

The numbers entered on the coloured test surfaces are PPFD readings. PPFD is an acronym for "Photosynthetic Photon Flux Density", which in layman's terms means the "intensity of light falling on a surface that is useable by plants". I have applied a colour gradient to the test grid to help you visualize the difference in intensity over the data collection surface.
The columns on the left contain some interesting figures that help us compare the test data.
The average PPFD Reading is a numerical value for the average light intensity over the surface.
The standard deviation is a statistical value representing how much the data for each square in the test grid differs from the average value. A lower standard deviation is better because it indicates that the light coverage is more consistent which will give more consistent light exposure to our trays of seedlings.
The last two rows refer to the DLI which is an acronym for Daily Light Integral. This is a numerical value describing the total amount of light falling on a surface per day. It is a common value used in the horticultural industry when discussing the amount of light plants need per day. We aim to provide at DLI of 10 to 15 when starting our vegetable seedlings indoors. See A Definitive Grow Light Study for a more thorough explanation of DLI.
The first test showed noticeable differences in intensity but this was to be expected. Since the power usage of the 48 watt SunBlaster LED light is about twice the power usage of the 23 watt Active Grow LED light, we would expect the light output to differ by about the same ratio.
The surprise from this first set of tests was the lopsided output of the Active Grow light (bottom dataset). The light intensity was significantly higher on the side of the lamp's power input, which was on the right. Looking the Active Grow data, we would expect the intensity in square C3 to be about the same as I3, but the intensity in square I3 is 28% higher than the intensity in square C3. Was this a weird flaw in this particular lamp we tested? Nope. I plugged in the other Active Grow lamp with the same setup and got the same results.
I have seen lopsided readings like this before when testing T5 florescent lights but the other LED lights I have tested are much more consistent. Nevertheless, I proceeded with the next configuration that had two lights connected in series and suspended over the same area. For the sake of the Active Grow lights, I hoped that having two lamps hooked up in series would help balance out the irregular light output along the length of the bulbs.
A selection of the data from the double LED tests is shown below. In this configuration, the two LED lamps were spaced 8 inches apart and tested again at heights of 4 inches, 6 inches, and 8 inches above the light sensor.

Did the double LED configuration help with the lopsided Active Grow output? Not really. Each Active Grow lamp was still significantly brighter on the end of its power input. On the Active Grow (AG) data table above, you can see that the lower bulb which was suspended right over row 4 has higher readings by its power input at square K4. Likewise, the upper bulb which was suspended over row 2 has higher readings by its power input at square A2. This resulted in a lot of variance in light intensity over the whole growing surface.
OK, but what if that lopsided light output wasn't a big deal? We could shuffle the trays around every couple of days so that the light exposure averages out over a few weeks. Since the intensity of these Active Grow lights is quite low, I would also recommend using them in banks of 4 much like our T5 florescent lights, and with 4 bulbs covering this surface instead of 2, the lopsided output would be less noticeable. Maybe the Active Grow lights give a higher overall light output per watt or per dollar spent, so let's move on to those other important figures.
Power Efficiency
The light output of a lamp per watt is an indication of its efficiency. A high efficiency would mean that a high percentage of the energy used is being converted into light. A low efficiency would mean that a significant amount of energy used is being wasted as heat. Let's compare the numbers of these two products. We'll use the data from the double LED test because that is more representative of the type of formation we would use in our seed starting nursery.
The double configuration of the SunBlaster lights hung at 6 inches above the light sensor gave us an average light intensity of 296 micromoles per meter squared per second. We can simply divide this number by the total number of watts used by these two lamps to get the overall efficiency.
SunBlaster Power Efficiency = 296 μmol/m2/s ÷ 96 W
SunBlaster Power Efficiency = 3.08 μmol/m2/s/W
The double configuration of the Active Grow lights hung at 6 inches above the light sensor gave us an average light intensity of 107 micromoles per meter squared per second. We can simply divide this number by the total number of watts used by these two lamps to get the overall efficiency.
Active Grow Power Efficiency = 107 μmol/m2/s ÷ 46 W
Active Grow Power Efficiency = 2.32 μmol/m2/s/W
The clear winner in this category is the SunBlaster LED with an output per watt that is 33% greater than the output of the Active Grow LED lights.
Cost Efficiency
Next, we will figure out the amount of light output per dollar spent on each type of light. I won't mind using a less efficient light if it was significantly cheaper so let's see how these two LED lights compare. The total cost over the lifetime of each lamp is its purchase price plus the cost of electricity over its lifespan.
The SunBlaster lights are selling for $129.99 CAD on Amazon right now, so the total cost for our double light configuration would be $259.98. These lights are rated for 50,000 hours of use and use 48 watts each so the total lifetime power consumption would be 4800kWh. We are currently paying $0.15/kWh so the total cost to operate these two lamps over their lifetime would be $720.
SunBlaster LED Cost Efficiency = 296 μmol/m2/s ÷ ($259.98 + $720)
SunBlaster LED Cost Efficiency = 0.30 μmol/m2/s/$
The Active Grow lights are selling for $119 USD on their website which is the equivalent of $151.19 CAD with today's exchange rates. The lights we tested are sold in a 2-pack for this price so $151.19 CAD is the total cost of our Active Grow double light configuration. Shipping costs would be added on top of this. These lights are rated for 40,000 hours of use, so the total cost to supply 50,000 hours of light to match the SunBlaster model would be $151.19 x 50,000h/40,000h = $188.99. Each of these lamps uses 23 watts so the total power consumption over these 50,000 hours would be 2300kWh. We are currently paying $0.15/kWh so the total cost to operate these two lamps over their lifetime would be $345.
Active Grow LED Cost Efficiency = 107 μmol/m2/s ÷ ($188.99 + $345)
Active Grow LED Cost Efficiency = 0.20 μmol/m2/s/$
The clear winner in this category is once again the SunBlaster LED model with a cost efficiency 50% greater than the cost efficiency of the Active Grow lights.
Conclusion
Typically, when I am comparing two products on the market, I find myself coming to the conclusion that you get what you pay for. Products that cost more often l have a higher quality and may also give you better results. This LED comparison appears to be an exception to this rule however. In all categories, the SunBlaster 48 inch LED model came out ahead of the Active Grow 48 inch LED model. We knew going into this test that the SunBlaster lamps should produce more light given their higher wattage, but when we look more closely at the numbers to actually figure out the power efficiency and the cost efficiency, the SunBlaster lamps come out ahead with a 33% greater power efficiency and 50% greater cost efficiency.
Based on these measured results, my obvious recommendation here would be to opt for the SunBlaster LED model. However, there is one variable still not accounted for. That is the difference in spectrum of these two lights. The Active Grow spectrum has a peak in the red spectrum that is missing from the SunBlaster spectrum. See the circled portion in the graph below. Light in the red spectrum is essential for vigorous growth and the SunBlaster model tapers off in this portion of the spectrum. While our quantum flux sensor offers a lot of precision, it unfortunately can only tell us the total amount of light within the 400nm to 700nm range. The next steps then would be to conduct a trial using plants and to carefully measure the plant response per watt over the same growing area to help differentiate between the light quality of each type of fixture. That's a project for another day.

You may also be wondering about how these LED grow lights compare to the T5 florescent counterparts. I have done a thorough comparison of differences between these two types of lights as well. You can find that comparison and more information about the science of grow lights in the post A Definitive Grow Light Study.


.png)


.png)